§ 169.9. Chart reading—general engine applications.
The following procedure shall be used in reading the smoke opacimeter recorder chart:
(1) Locate the start of the acceleration modes tested under the provisions of § 169.5(2)(i) and (iii) (relating to smoke test cycle) and the start of the lugging mode tested under the provisions of § 169.5(3) on the speed trace.
(i) Divide both of the acceleration modes into .5 second intervals beginning at the start of the first acceleration of each test. Determine the average smoke reading during each .5 second interval.
(ii) Locate and record the 15 highest .5 second readings during both acceleration modes of each smoke cycle. Average the 45 readings from the three cycles. Record and designate this value as (a), which shall represent the acceleration smoke characteristic of the engine.
(2) Locate the lugging mode tested under the provisions of § 169.5(4).
(i) Divide the lugging mode into .5 second intervals and determine the average smoke readings during each .5 second interval.
(ii) Locate and record the five highest .5 second intervals during the lugging mode. Average the 15 readings from the three cycles. Record and designate this value as (b), which shall represent the lugdown smoke characteristics of the engine.
(3) Reexamine the average .5 second intervals of paragraphs (1)(ii)—(2)(ii) and locate the highest .5 second reading during each dynamometer cycle. Average these three readings from the three cycles. Record and designate as (c), which shall represent the peak smoke opacity characteristic of the engine.
(4) Locate the last 15 seconds of the rated speed mode of each cycle tested under the provisions of § 169.5 (3)(ii). Determine the average smoke reading during this period. Average the three values and record and designate as (d), which shall represent the full load, rated speed smoke characteristic of the engine.
(5) Locate the last 15 seconds of the intermediate speed mode run of each cycle tested under the provisions of § 169.5(5). Determine the average smoke reading during this period. Average the three values and record and designate as (e), which shall represent the full load, intermediate speed smoke characteristic of the engine.
Source The provisions of this § 169.9 adopted August 26, 1977, effective August 27, 1977, 7 Pa.B. 2432.
APPENDIX A
VALIDITY OF BEER-LAMBERT RELATIONSHIP
In November 1967, the SAE Diesel Smoke Measurement Task Force conducted a test program to establish the correlation between a number of diesel smoke measurement systems. A secondary goal of this task force was to establish the validity of the Beer-Lambert relationship for the transmission of light through various diameter plumes: T = e –naQ1= e –K1
Where:
T = transmission.
n = number of particles per unit volume.
a = mean particle projected area.
Q = particle extinction coefficient.
l = length of light path.
e = base of natural logarithms.
The n, a, and Q variables are often referred to as the turbidity on attenuation coefficient (k); and are constant for a given soot density.
In the final published report, the SAE Task Force concluded that the Beer-Lambert relationship was usable for transmission predictions.
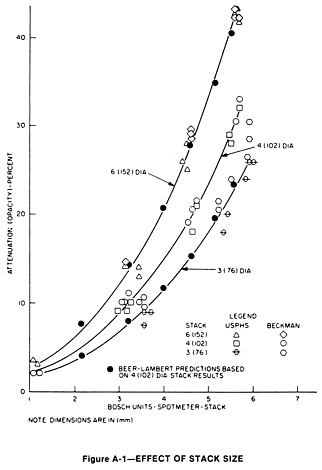
Figure 5 of the Task Force report (A.W. Carey Jr., ‘‘Steady-State Correlation of Diesel Smoke Meters.’’ Paper 690492 presented at SAE Mid-Year Meeting, Chicago, May 1969) is reproduced in this appendix as Figure A-1. The following is noted in the report:
‘‘Fig. 5 presents the results obtained when the stack size was varied. The effect of stack size as shown in Fig. 5 clearly demonstrates the powerful influence this variable has on the apparent opacity of the smoke column. It is entirely reasonable to expect that the greater optical path length through the smoke column issuing from the 6 inch diameter stack will produce greater extinction of the light than would that from a 3 inch stack. The effect is predicted quite accurately by the Beer-Lambert relationship, as evidenced by the Beer-Lambert prediction points which have been placed along the 6 inch diameter and 3 inch diameter correlation lines. These Beer-Lambert predictions are based on the observed opacity correlation obtained with the 4 inch diameter stack and accuracy of the prediction is excellent.’’
The results of this test are included in SAE J255.

Figure A-1—EFFECT OF STACK SIZE
Source The provisions of this Appendix A adopted August 26, 1977, effective August 27, 1977, 7 Pa.B. 2432.
No part of the information on this site may be reproduced for profit or sold for profit.
This material has been drawn directly from the official Pennsylvania Code full text database. Due to the limitations of HTML or differences in display capabilities of different browsers, this version may differ slightly from the official printed version.